Winter chill by location
Open the interactive location map. PNG · SVG · Station CSV.
What the map shows
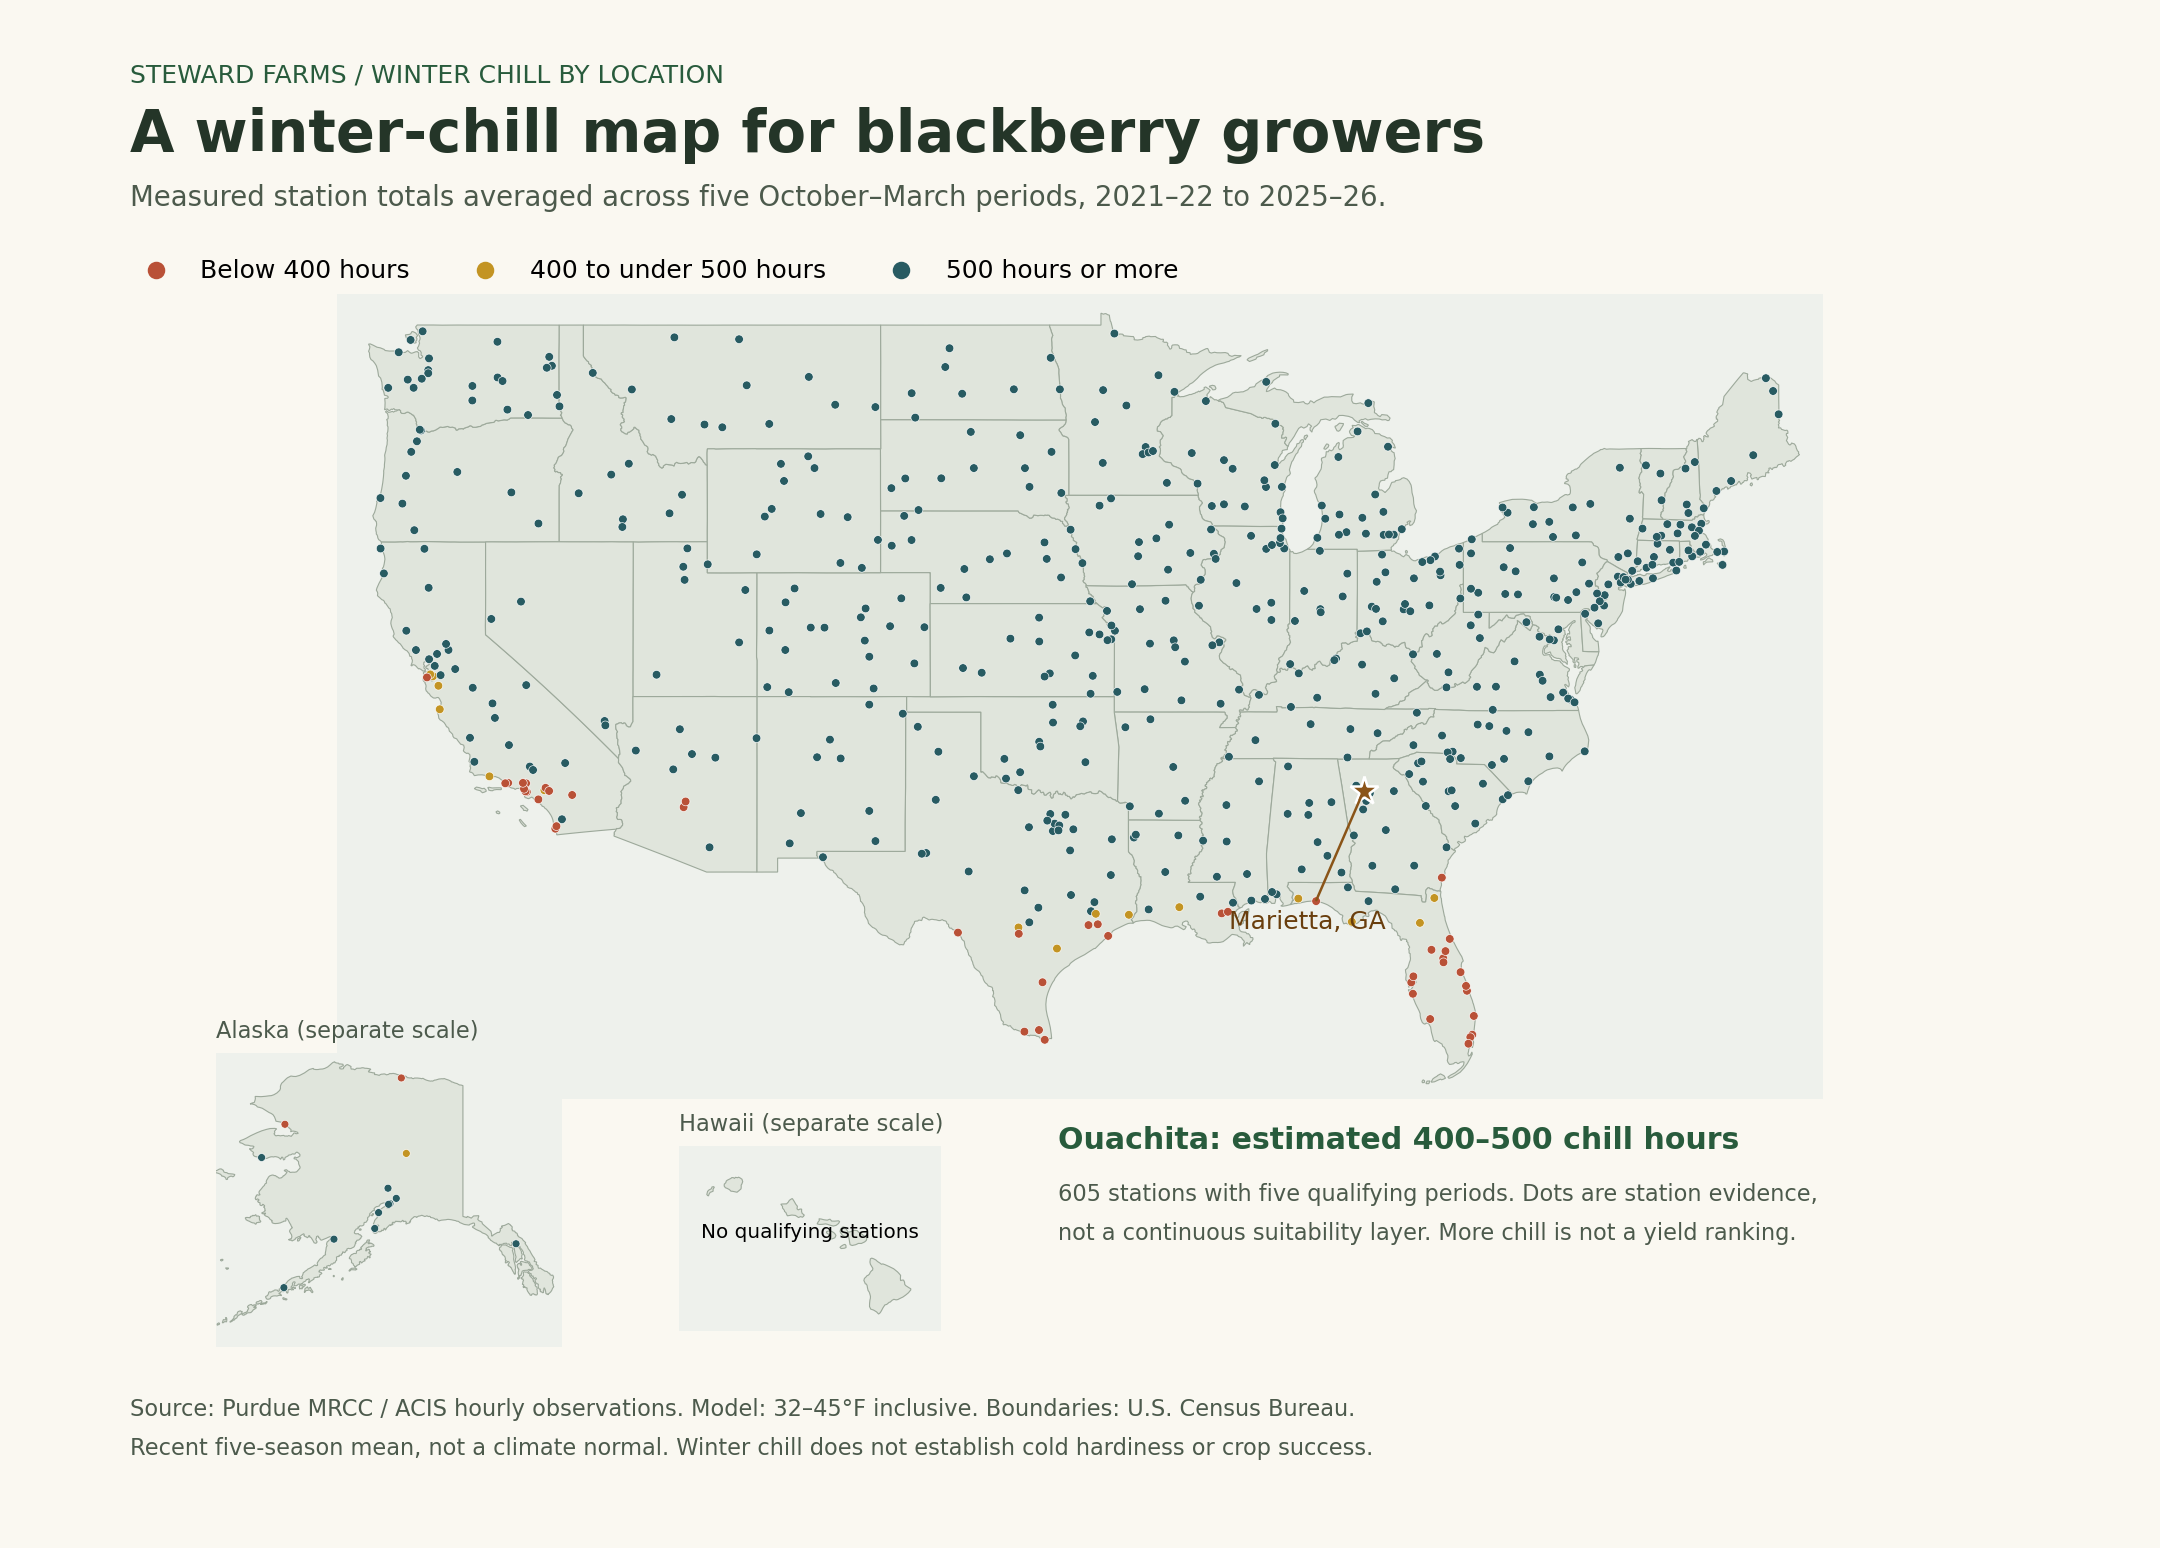
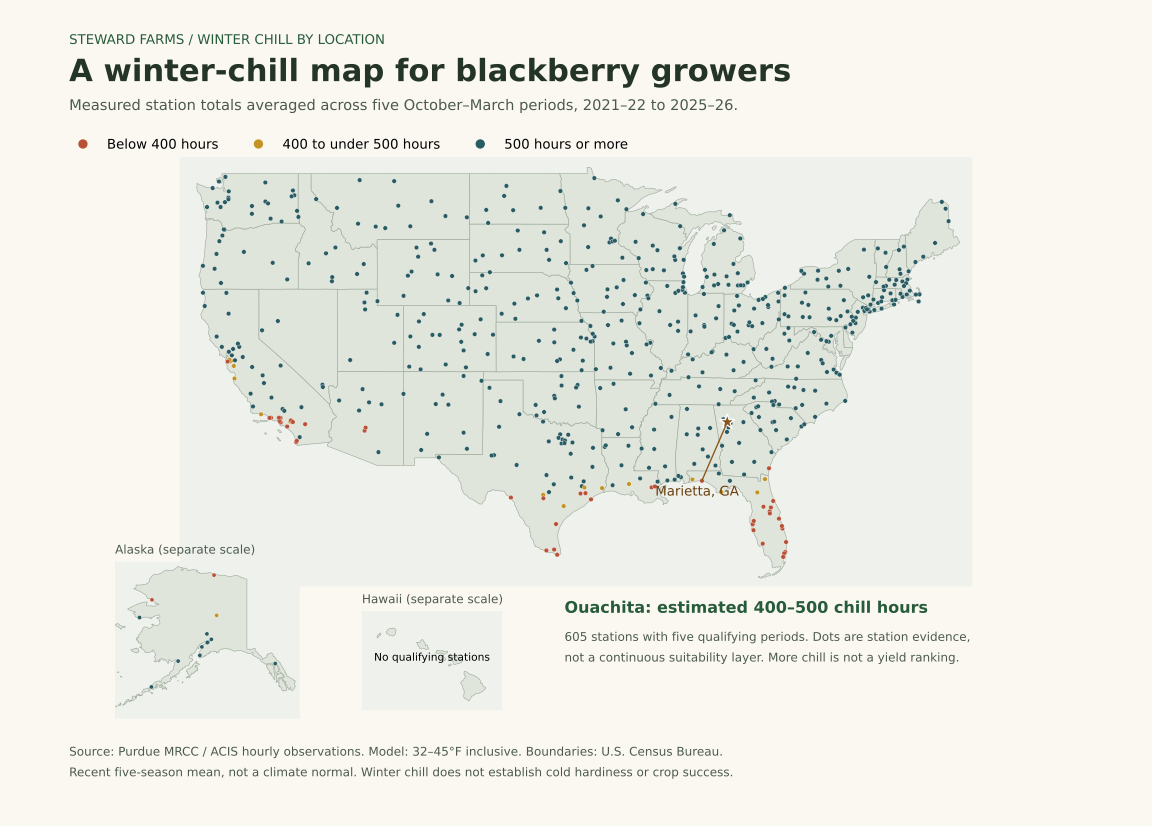
This original Steward Farms visualization uses 605 weather stations with usable values in five selected periods. Each period runs October 1 through March 31, for winters 2021–22, 2022–23, 2023–24, 2024–25 and 2025–26. Each hour with an observed temperature between 32°F and 45°F inclusive counts toward accumulation. The default is the arithmetic mean of those five period totals. It is a recent five-period summary, not a 30-year climate normal, forecast, full-year total or parcel-level suitability map.
Station dots retain geographic variation rather than coloring whole states. Alaska has its own view; Hawaii has no station meeting the five-period criteria in this snapshot. Blank coverage means no qualifying evidence here, not zero chilling. The snapshot includes stations in 49 states; the District of Columbia has none meeting the criteria.
Interactive controls change the cultivar comparison, select an individual period, narrow to a state, search a station name/city text, or select a station from a keyboard-accessible list. Clicking a map location selects the nearest qualifying station and reports the approximate distance. “Near Marietta” uses a city reference point, not the farm’s street address. It selects a nearby station without claiming that station measured the farm.
For each station the page shows all five totals, their mean and range, missing-day percentages, and how many periods reached the selected cultivar’s upper published estimate. Colors compare the chosen statistic with the published estimate; they are not a recommendation to buy a cultivar. For a single published estimate there is no intermediate range color. The source-linked variety chart explains differences between published estimates.
Data provenance and screening
Source: Purdue MRCC Custom Chilling Hours Tool, with method documentation. Raw responses and request URLs are preserved in data/mrcc-us-2021-2022.json through data/mrcc-us-2025-2026.json. All 50 states and DC were explicitly included in each request. Omitting those selections returns the tool’s default Midwest subset, so the first exploratory default response is not part of the map.
MRCC obtains hourly ASOS/AWOS observations via ACIS and applies missing-data screening. Our additional selection keeps a station only if it appears in all five responses with finite, nonnegative hours and at most 10% missing days in each requested period. No missing temperatures are filled; no accumulation is scaled to replace missing days. Totals with some missing days may undercount exposure. Sources provide station totals; the arithmetic five-period mean, variation summary and threshold comparison are our calculations.
Seasonal source rows returned before our five-period intersection: 829, 815, 807, 798 and 764. The intersection has 605 stations, including 14 in Georgia. Stable station IDs join periods; retained latest coordinates/names are recorded in the summary. The API snapshot is preserved so later source revisions do not silently alter this review copy.
Boundaries: U.S. Census cartographic files, specifically cb_2024_us_state_20m.zip. They are simplified geography for display, not property boundaries. Boundary geometry does not supply the chill values.
Limits that belong beside the map
Use the same temperature model when comparing a local dataset with the cultivar guidance. The common October–March window may omit chill accumulated outside it. Individual winters vary; a five-period mean can exceed the target while one or more selected periods fall below it. Station distances, missing observations, elevation and garden microclimates matter. Winter cold hardiness, spring frost, summer heat and plant stage are separate considerations. Chilling is not a refrigeration instruction for young tissue-culture plants.