Choose an area, station and variety
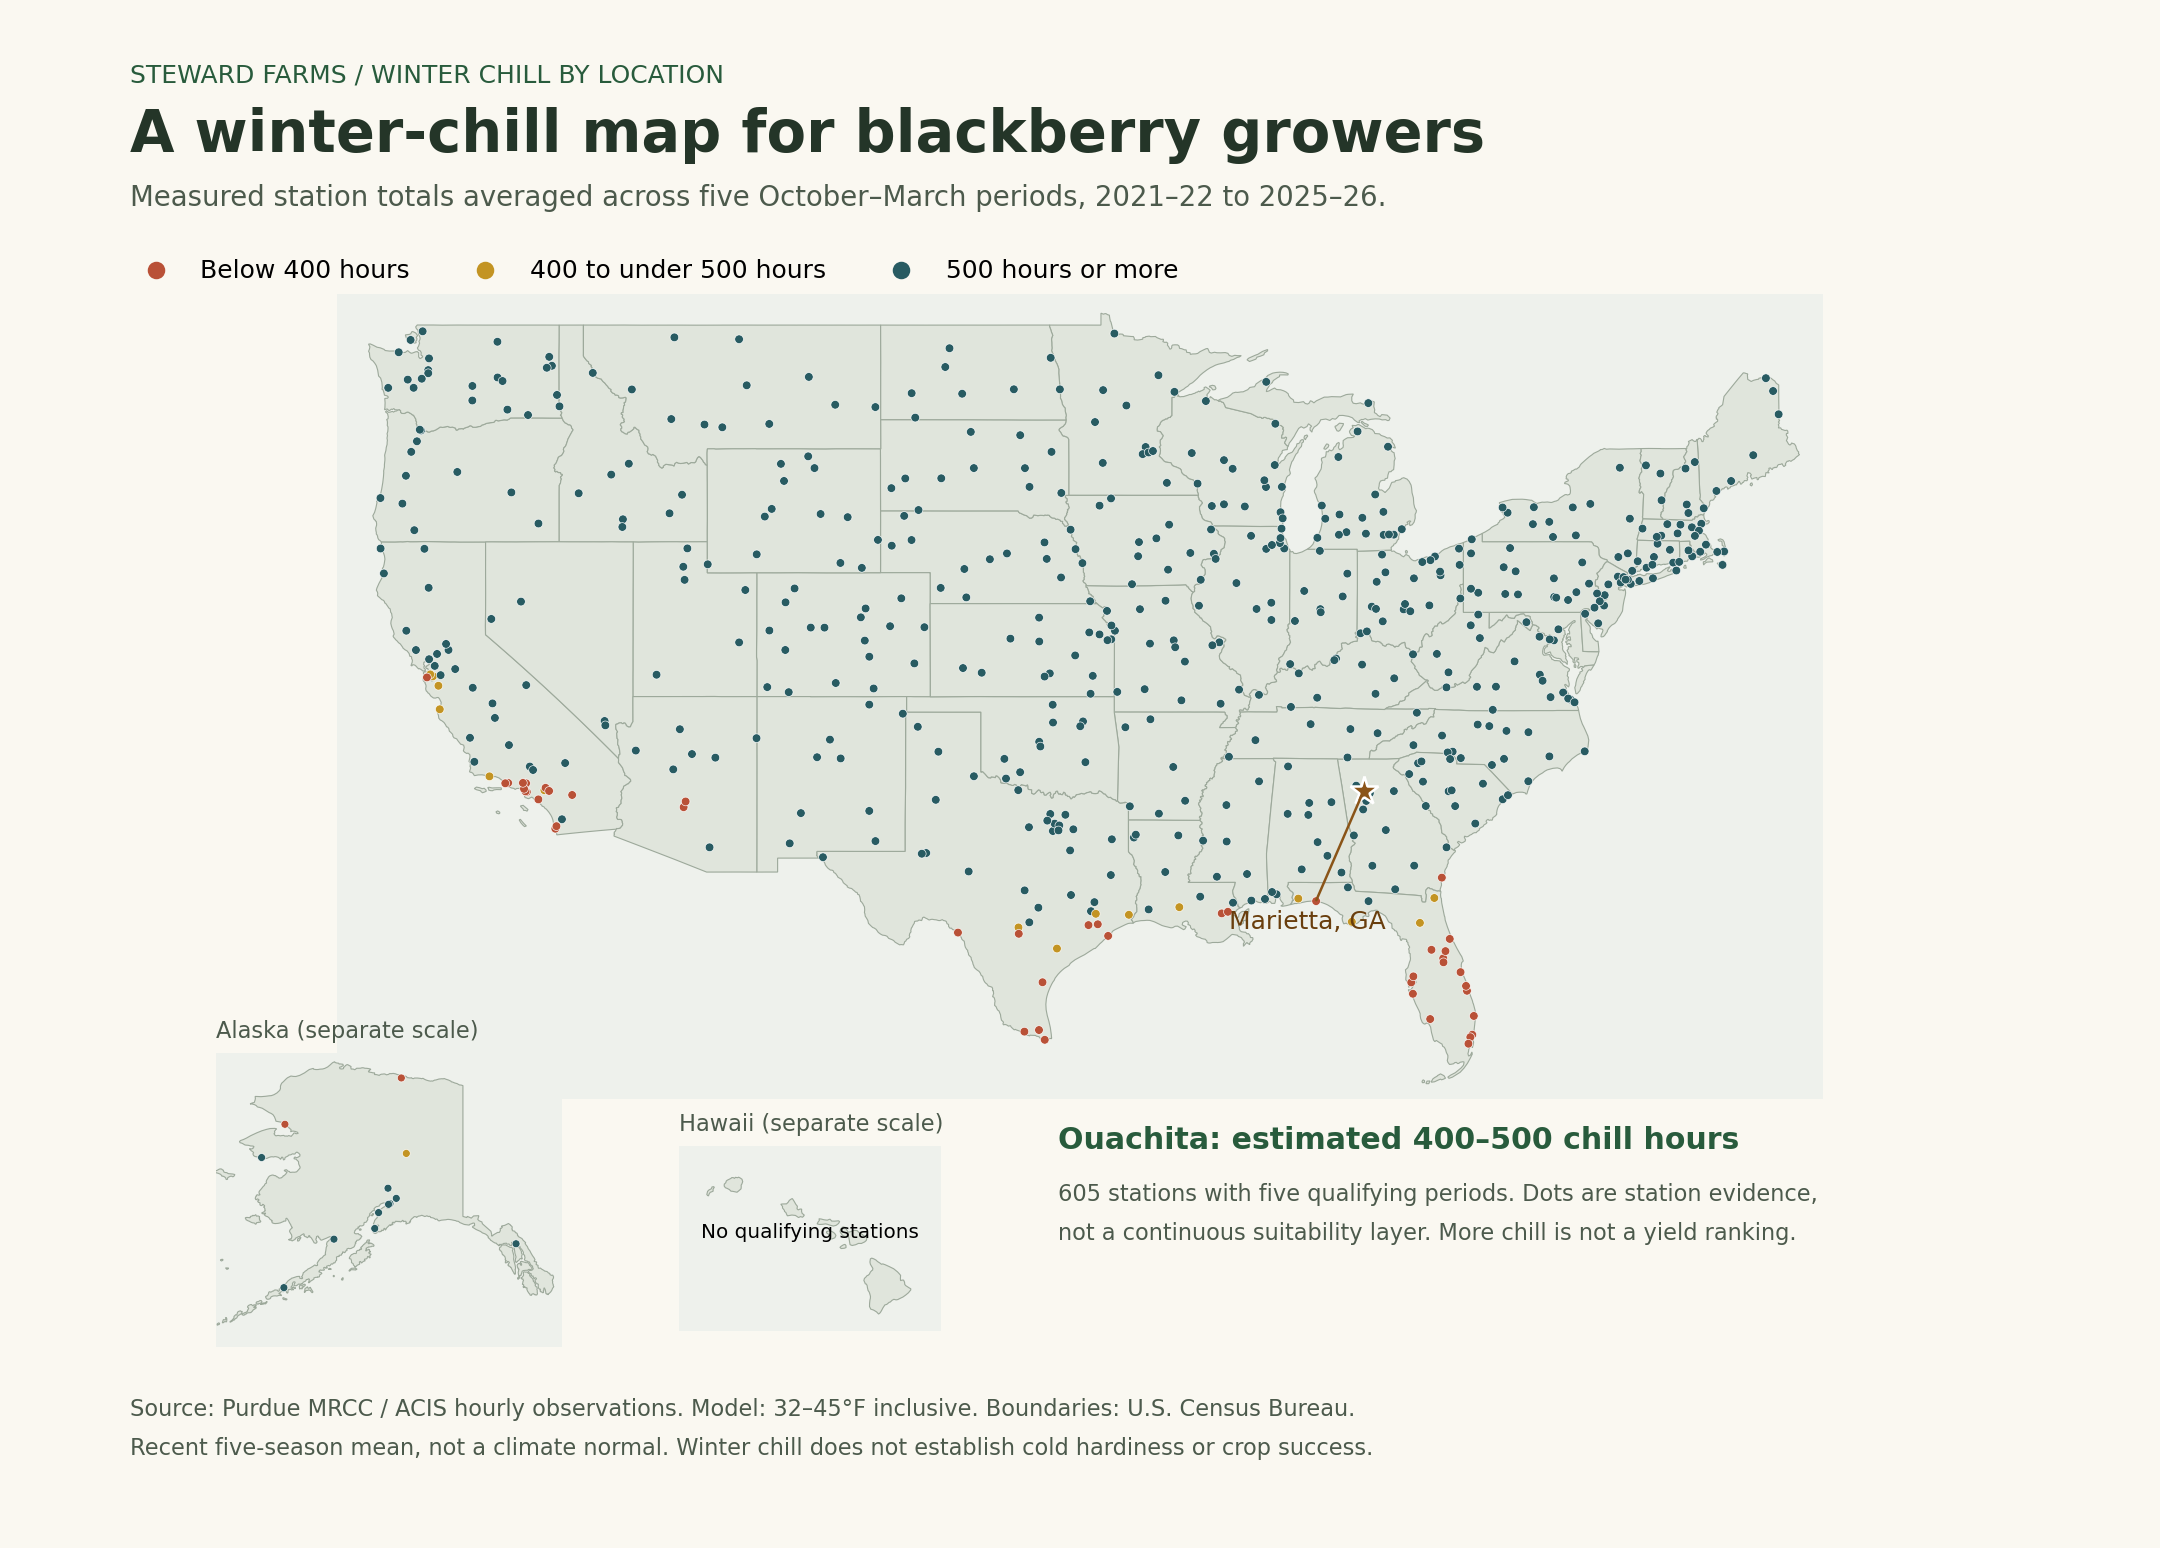
Select a dot or click near a location to inspect its nearest qualifying station. Zoom with the buttons; select a station from the list for keyboard access. Dots show observations, not a continuous suitability zone.
Selected station
| Winter | Chill hours | Missing days |
|---|
What if your winter does not provide enough chill?
Some growers supply part of the cold exposure in a controlled cold room. The plant still needs an appropriate seasonal cycle; the equipment changes where the cold comes from.
University research includes Ouachita grown as dormant containerized long canes, using a walk-in cooler at about 39°F (4°C). That is a different stage from a small green plug or a shoot in a tissue-culture jar. Read the 2025 study.
Does purchasing a walk-in freezer solve the problem?
The actual operating conditions matter more than the box’s name. The cooler treatment above does not support putting young plants into an ordinary freezer setting. Equipment needs to suit a defined production plan; no particular freezer conversion is validated here.
After storage, plants still need a suitable growing environment. The university’s 2026 field-day report describes growers exploring containers, walk-in coolers and hoop houses.
Can I use this map to calculate days in a cooler?
A station’s five-period mean is not a measurement of a particular plant’s chilling. Do not subtract that average from a cultivar number and treat the difference as a storage recipe. Keep the outdoor climate comparison separate from a plant-specific controlled-chilling plan.
Downloadable location map
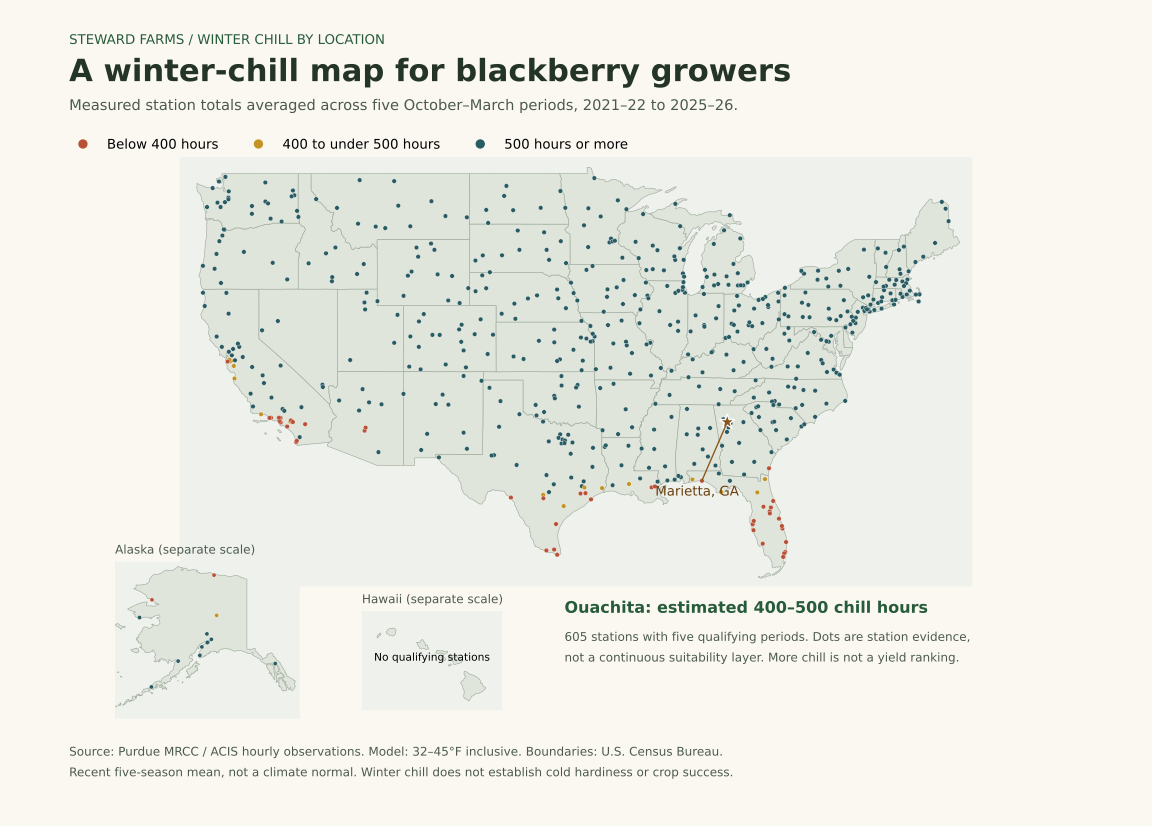
The map and station CSV below remain available without JavaScript.
How to read the map before choosing plants
Start with the station nearest your area, then look at the individual years as well as the mean. A mean above a cultivar’s requirement does not mean every winter reaches it. Consider station distance, missing observations and your garden’s microclimate.
The displayed October–March window is consistent across locations; some places accumulate additional chill outside it. Cold hardiness, frost, summer heat and site conditions still matter. This map does not certify growing suitability or shipping eligibility.
Sources: Purdue MRCC station data and methodology; U.S. Census boundaries; cultivar estimates and source differences. Prepared November 5, 2026. No live weather feed or ZIP-code lookup is implied.